
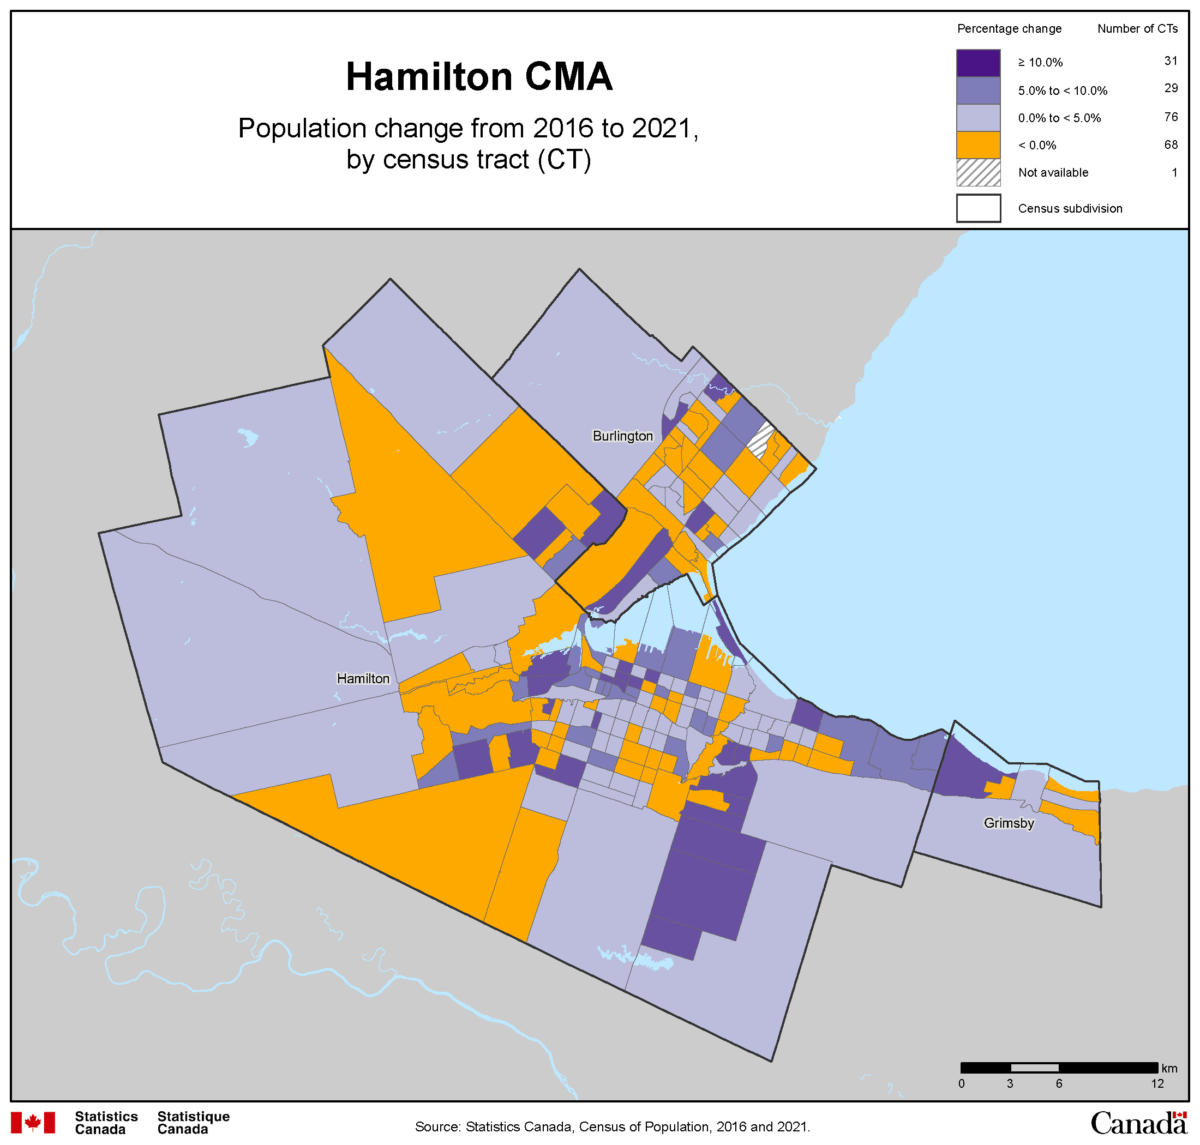
Hamilton’s population increased by 32,436 between the 2016 and 2021 censuses, bringing our total population estimate to 569,353 people, an increase of 6.04 percent from the 2016 population estimate of 536,917.
Downtown Hamilton, and the Wider Downtown Area
11.7 percent of population growth during these five years occurred within or close to the provincially defined Downtown Hamilton Urban Growth Centre. [See map embedded directly below]
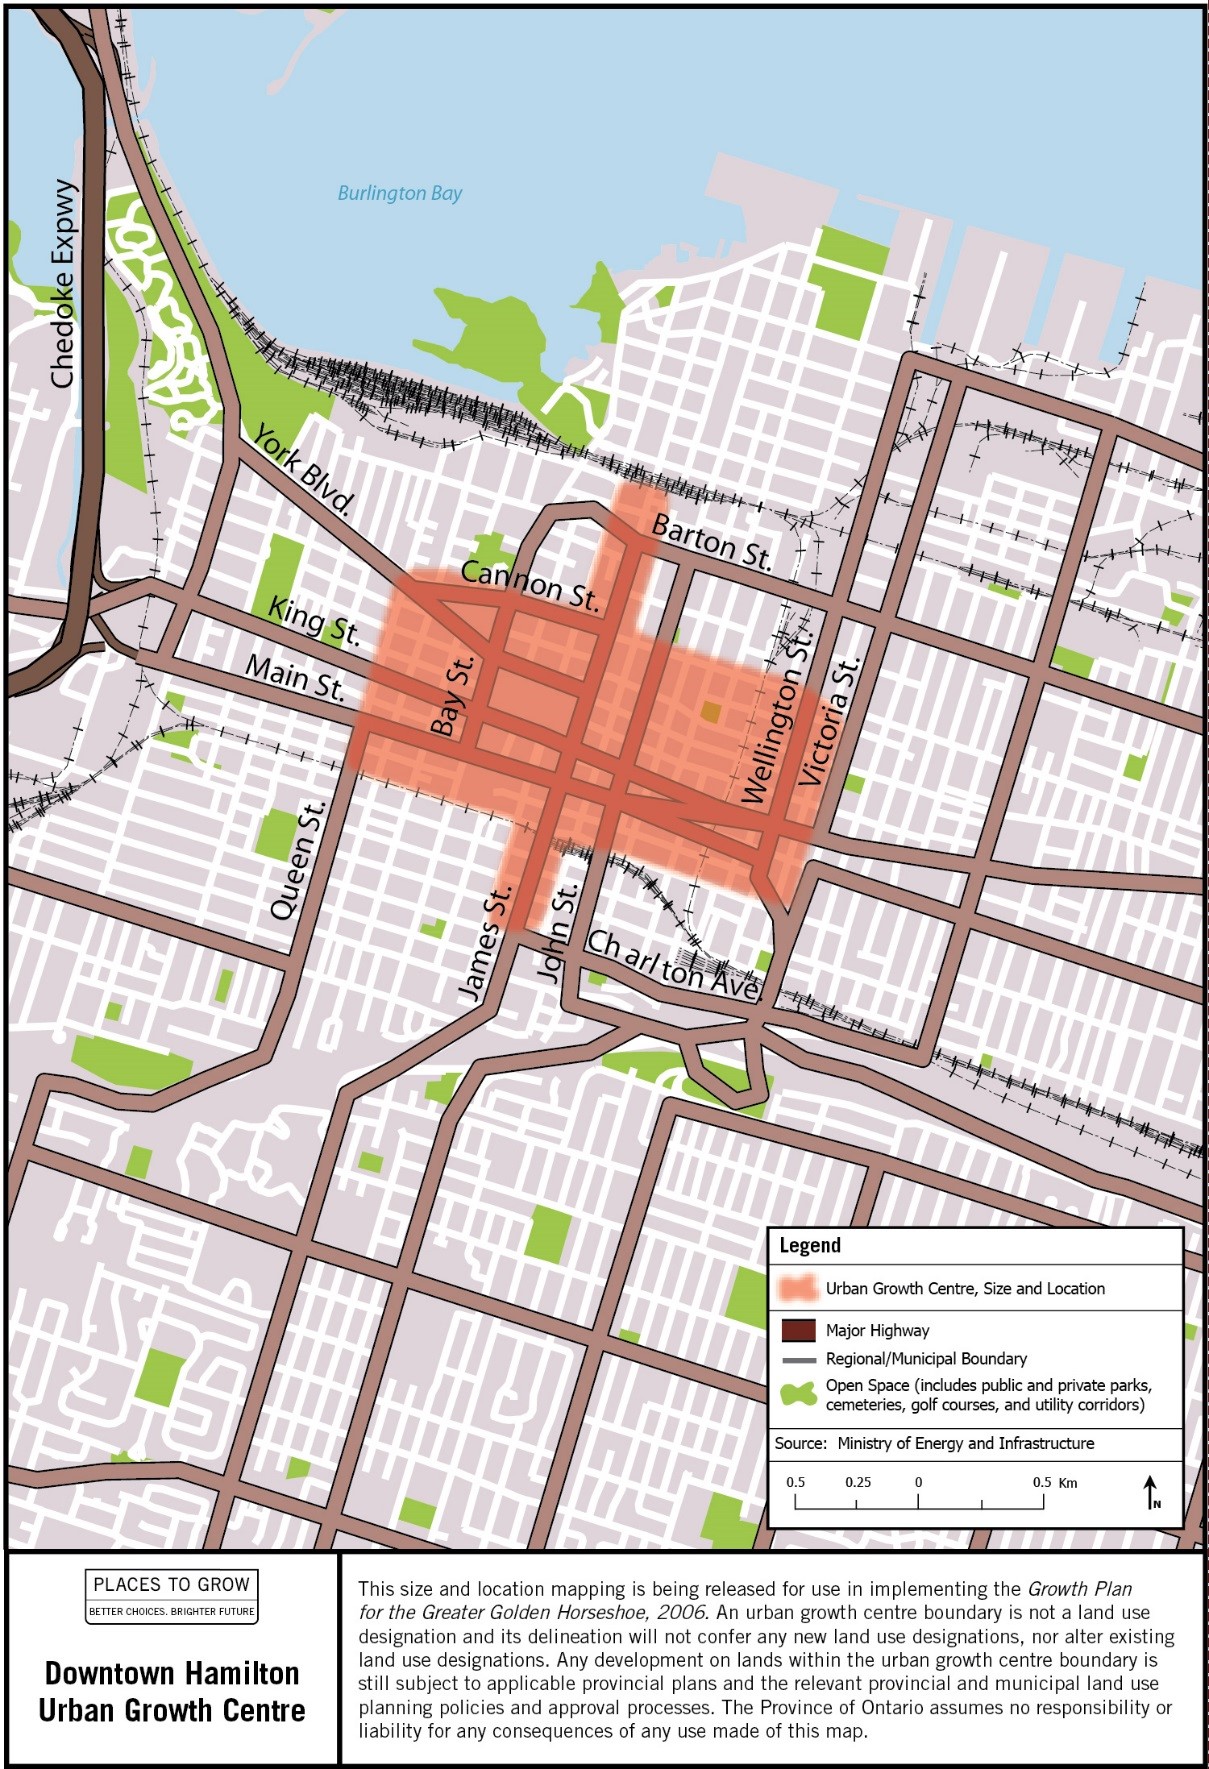
The population living between Queen Street to Wellington Street, between the Escarpment and CN rail line, increased by 3,783 people to a total of 31,876 people.
This represents an average of 894.11 new people per square kilometre (km2). These census tracts are Hamilton’s most dense area with an average of 8301.86 people per km².
Note: Census Tract 5370034, South Corktown, includes the Vista Condos east of Wellington Street at 467 Charlton Avenue East.
The population of the three census tracts between Wellington Street and Wentworth Street, between the CP and CN rail lines, increased by 993 people, the population of these tracts increasing to 11,650.
Overall, this wider downtown area absorbed approximately 14.7 percent of Hamilton’s population growth, with a total population of 43,526 people.
66,666 people live in the Lower City between Highway 403 and Wentworth Street representing 11.7 percent of Hamilton’s total population.
The land area of this portion of the Lower City is 17.57 km², 1.5 percent of Hamilton’s overall land, Hamilton is 1,138 km².
The average population density for this area is 6,004.66 people per km².
The population of the inner-core of Hamilton’s Downtown increased by 2,165 people, increasing the inner core’s population to 11,565, an increase of 21.85 percent.
The four census tracts of the inner-core absorbed 6.7 percent of Hamilton’s overall population growth, and are expected to see a higher rate of growth between now and the next census in 2026.
Hamilton’s most dense census tract is CT 5370039, West Durand, with a population of 5,127 people in an area of 0.35 km², a density of 15,986.7 people per km².
East Durand, CT 5370038, has a population of 4,172 people in an area of 0.33 km², a density of 12,539.8 people per km².
Waterdown Growth Area
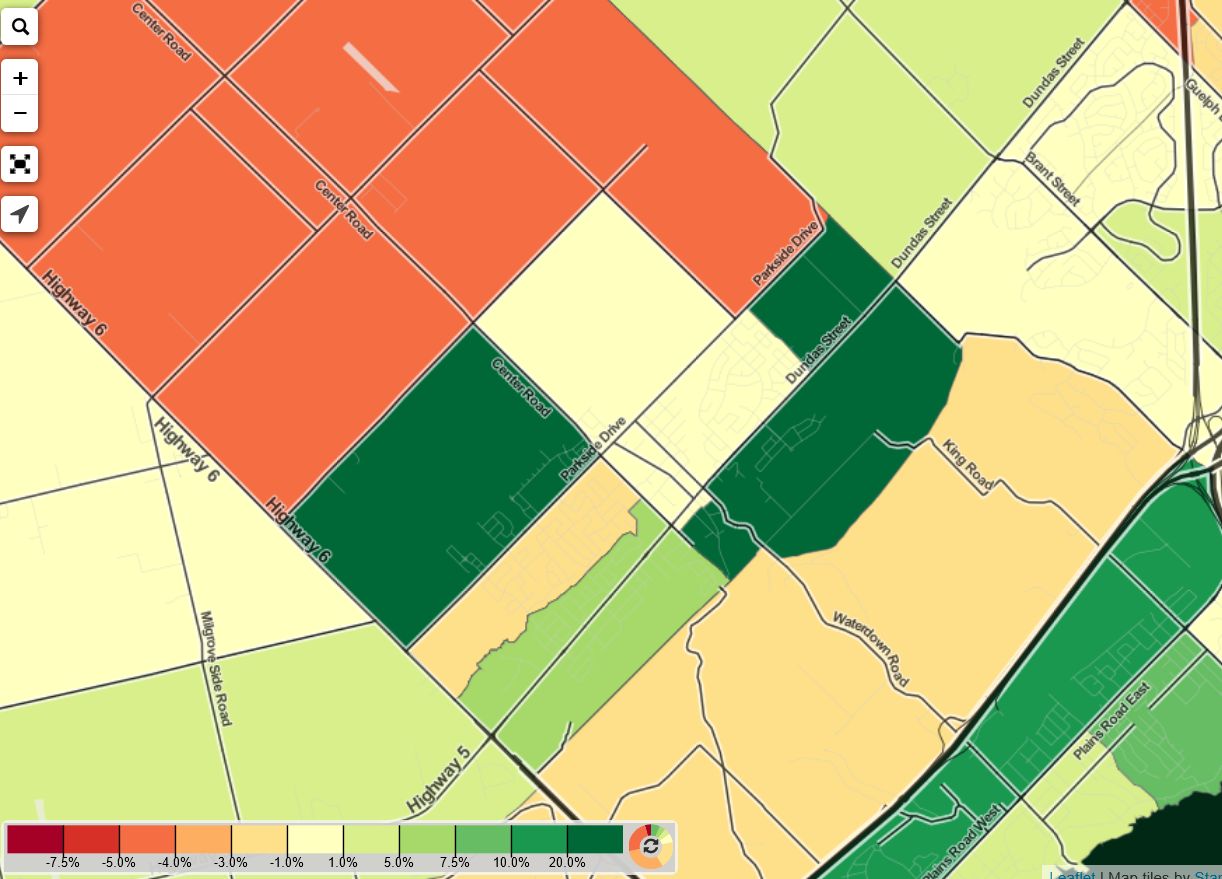
The population of Waterdown increased by 4,040 people, increasing by 40.7 percent to 23,858 people.
The population density of Waterdown is now 1,380.56 people per km².
Nearly of all Waterdown’s population growth was in the new subdivisions located within CTs 5370140.05 and 5370140.08. These two tracts grew by 3,962 people.
Two of the older neighbours of Waterdown saw slight decreases in population. The population in the areas bordering Dundas Street between Hamilton Street and Highway Six grew by 6.3 percent (CT 5370140.04).
Here’s a visualization using CensusMapper.ca:
Upper Stoney Creek Growth Area
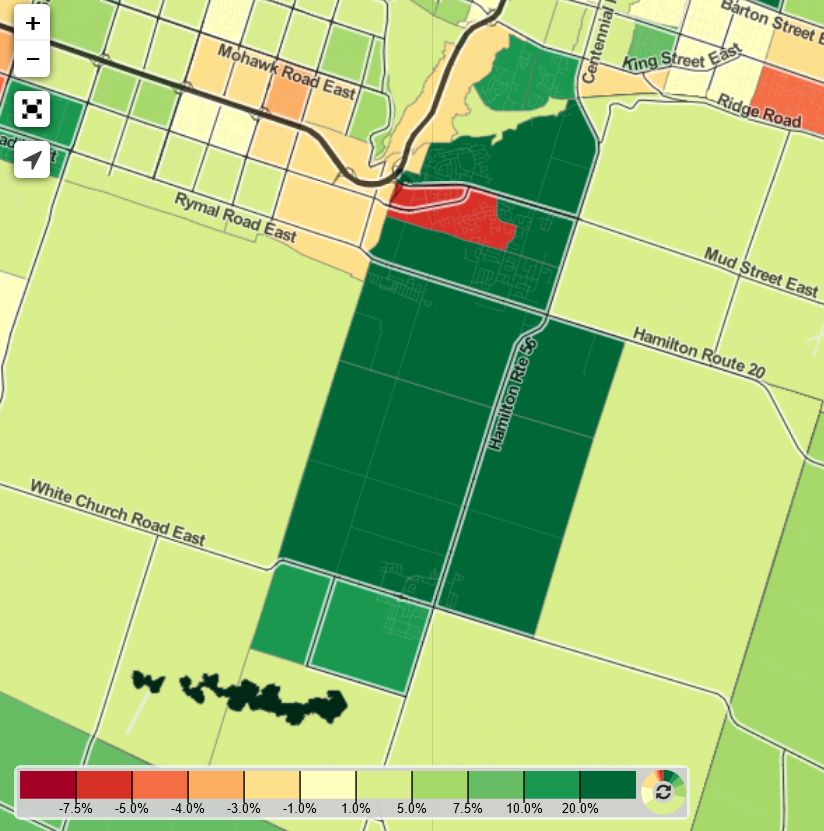
The new developments in Upper Stoney Creek increased the population of this urban area by 7,612 people.
Over half of this growth was along the Rymal Road corridor. The two CTs (5370080.05 & 5370100.03) grew by 4,381 people combined between 2016 and 2021.
The CT south of Rymal’s population increased by 61.5 percent, from 4,726 people in 2016 to 7,631 in 2021.
The population decreased in the older subdivisions of the Valley Park neighbourhood CT (5370080.06) by 6.1 percent. The 2016 census reported a population of 5,276. In 2021, the population is 4,925, which is 324 fewer people.
We have to wait until population demographic profile data is released by Statistics Canada on April 27 to better determine possible reasons that can be attributed to age.
The average population density of Upper Stoney Creek’s urban area north of Rymal Road is 2,432.25 people per km².
The population density of the Felker neighbourhood CT (5370080.07) is 3,184.20 per km², with more housing being built in this CT.
Binbrook Growth Area
The population of Binbrook increased by 1,983 people between 2016 and 2021, reaching an estimated population of 5,757 people in 2021.
The Binbrook CTs (5370100.04 & 5370100.05) both include agricultural lands, meaning density calculations require using dissemination block data.