

I compiled City of Hamilton voter turnout percentage data from a few sources into a CSV spreadsheet, and am sharing it here. (Download the CSV)
An important note regarding a limitation of the data. Hamilton’s ward boundaries changed in 2018, resulting in significant changes.
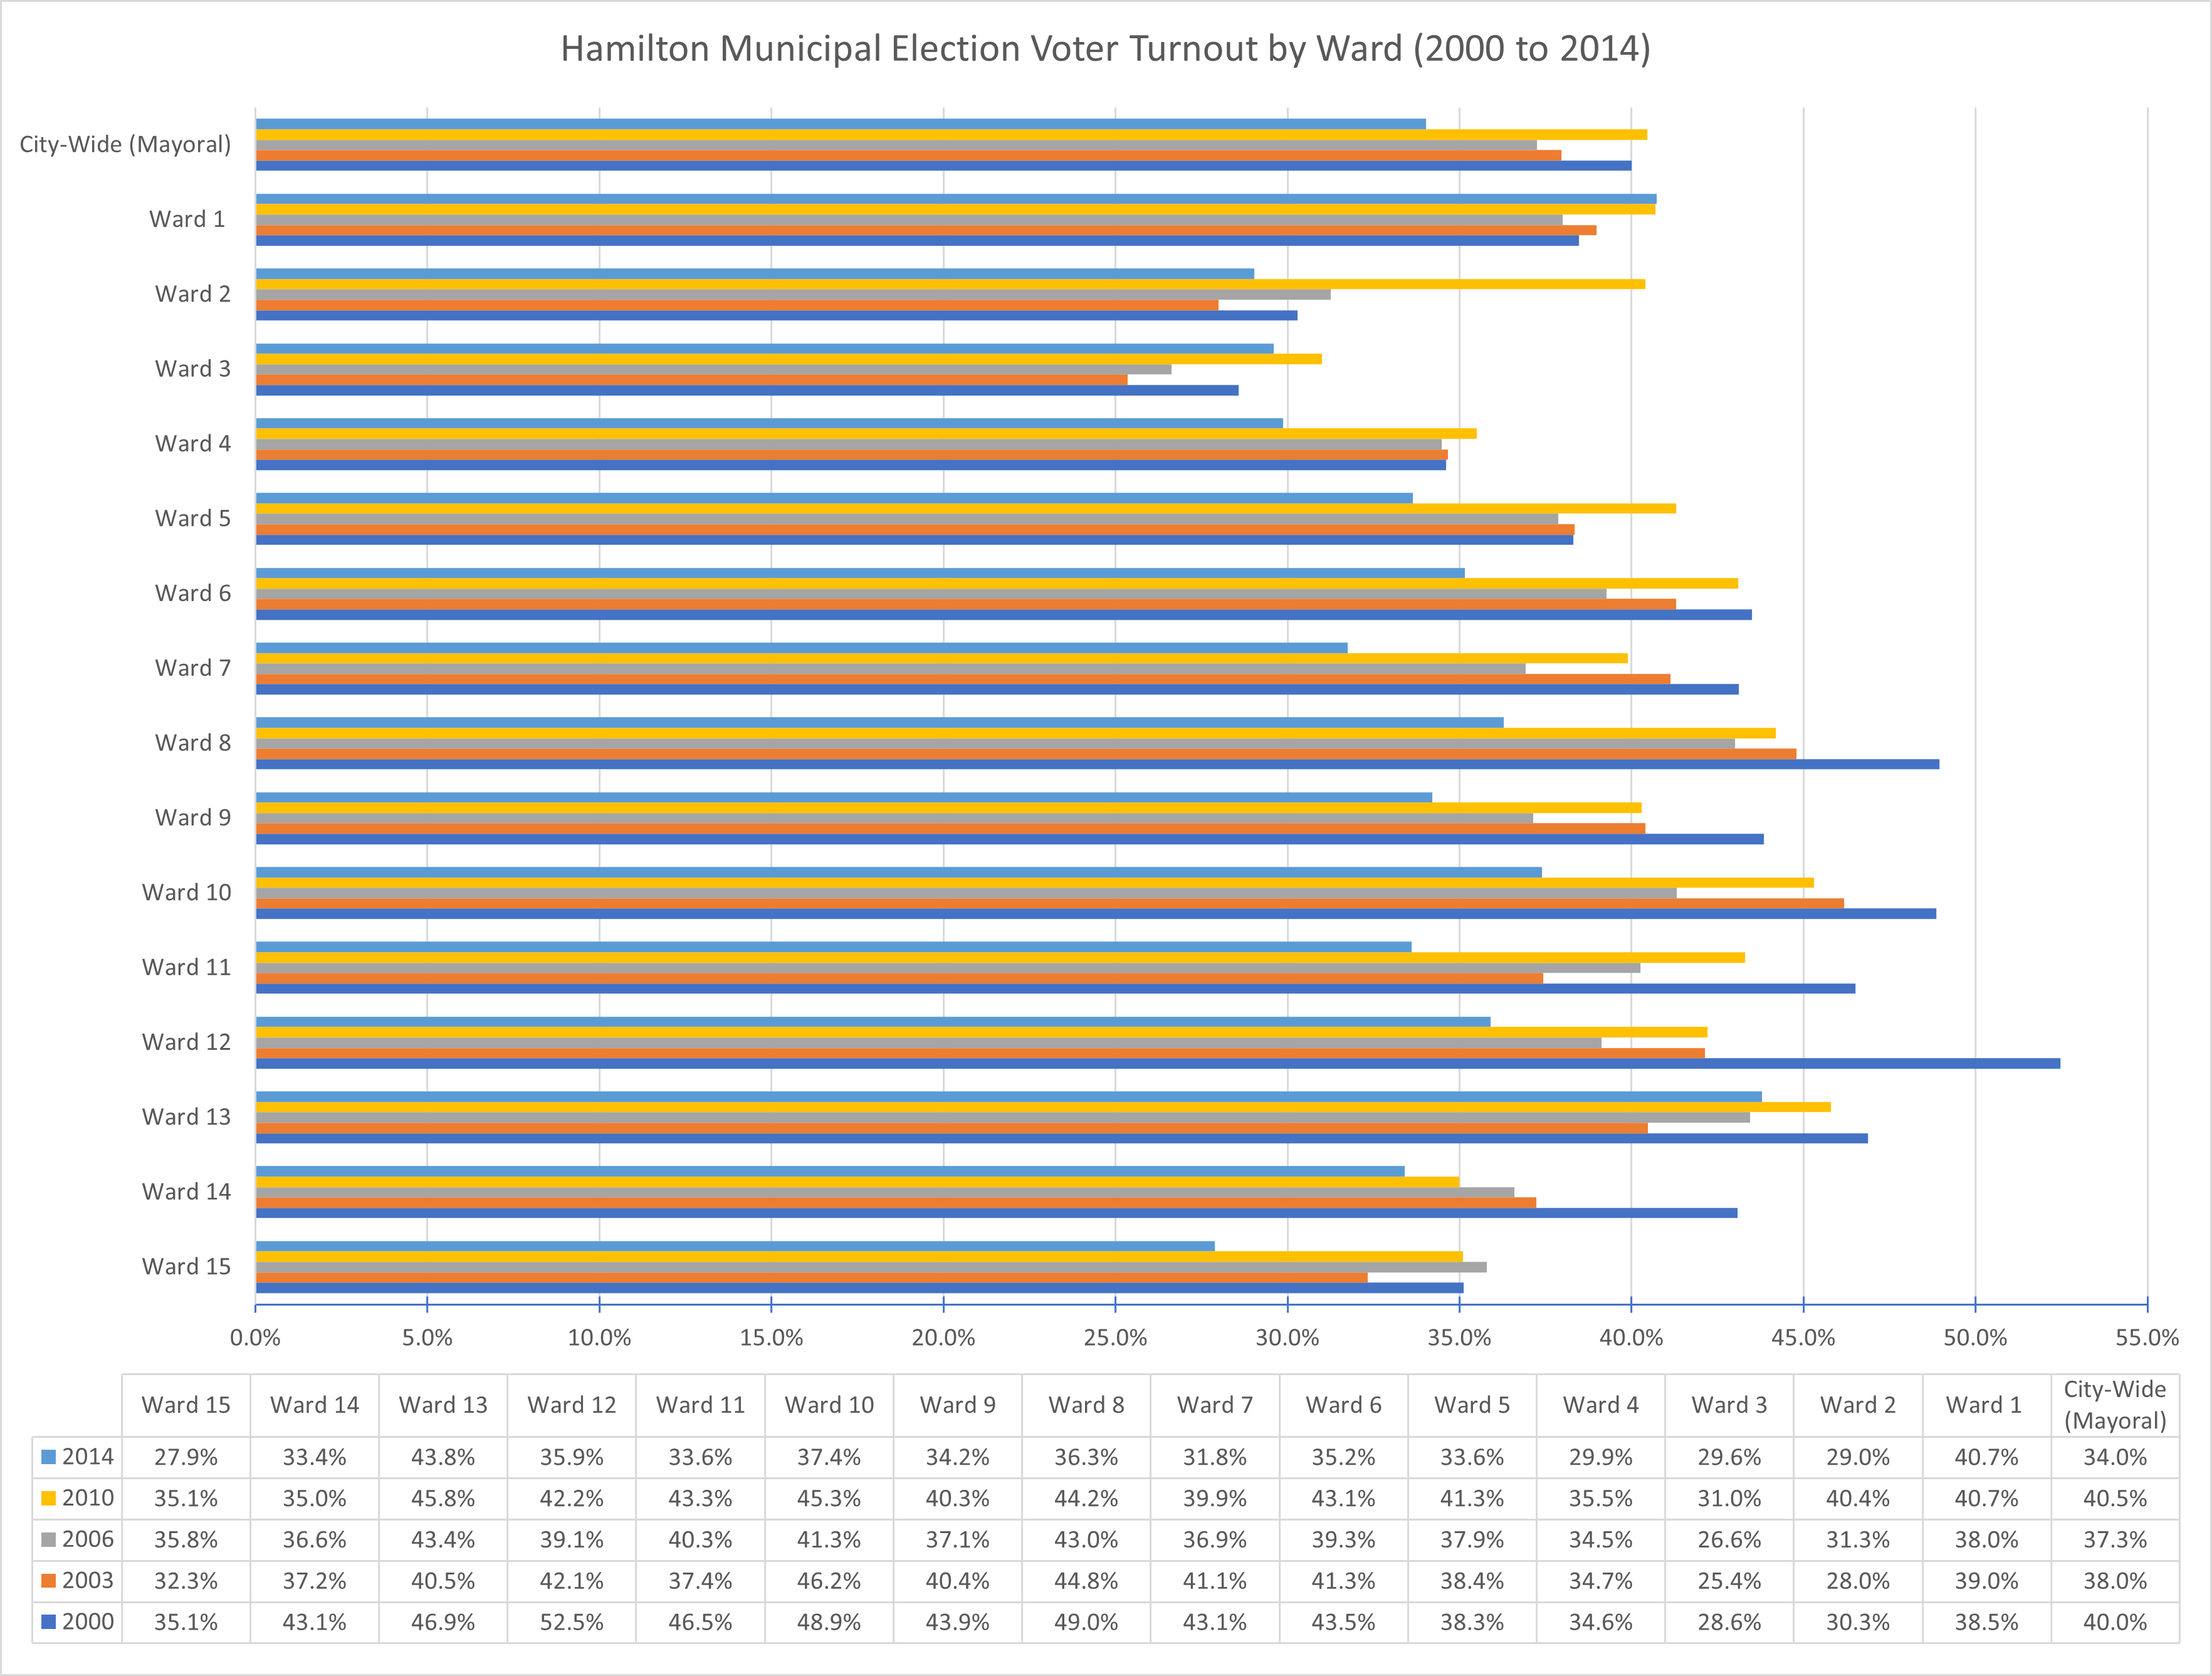
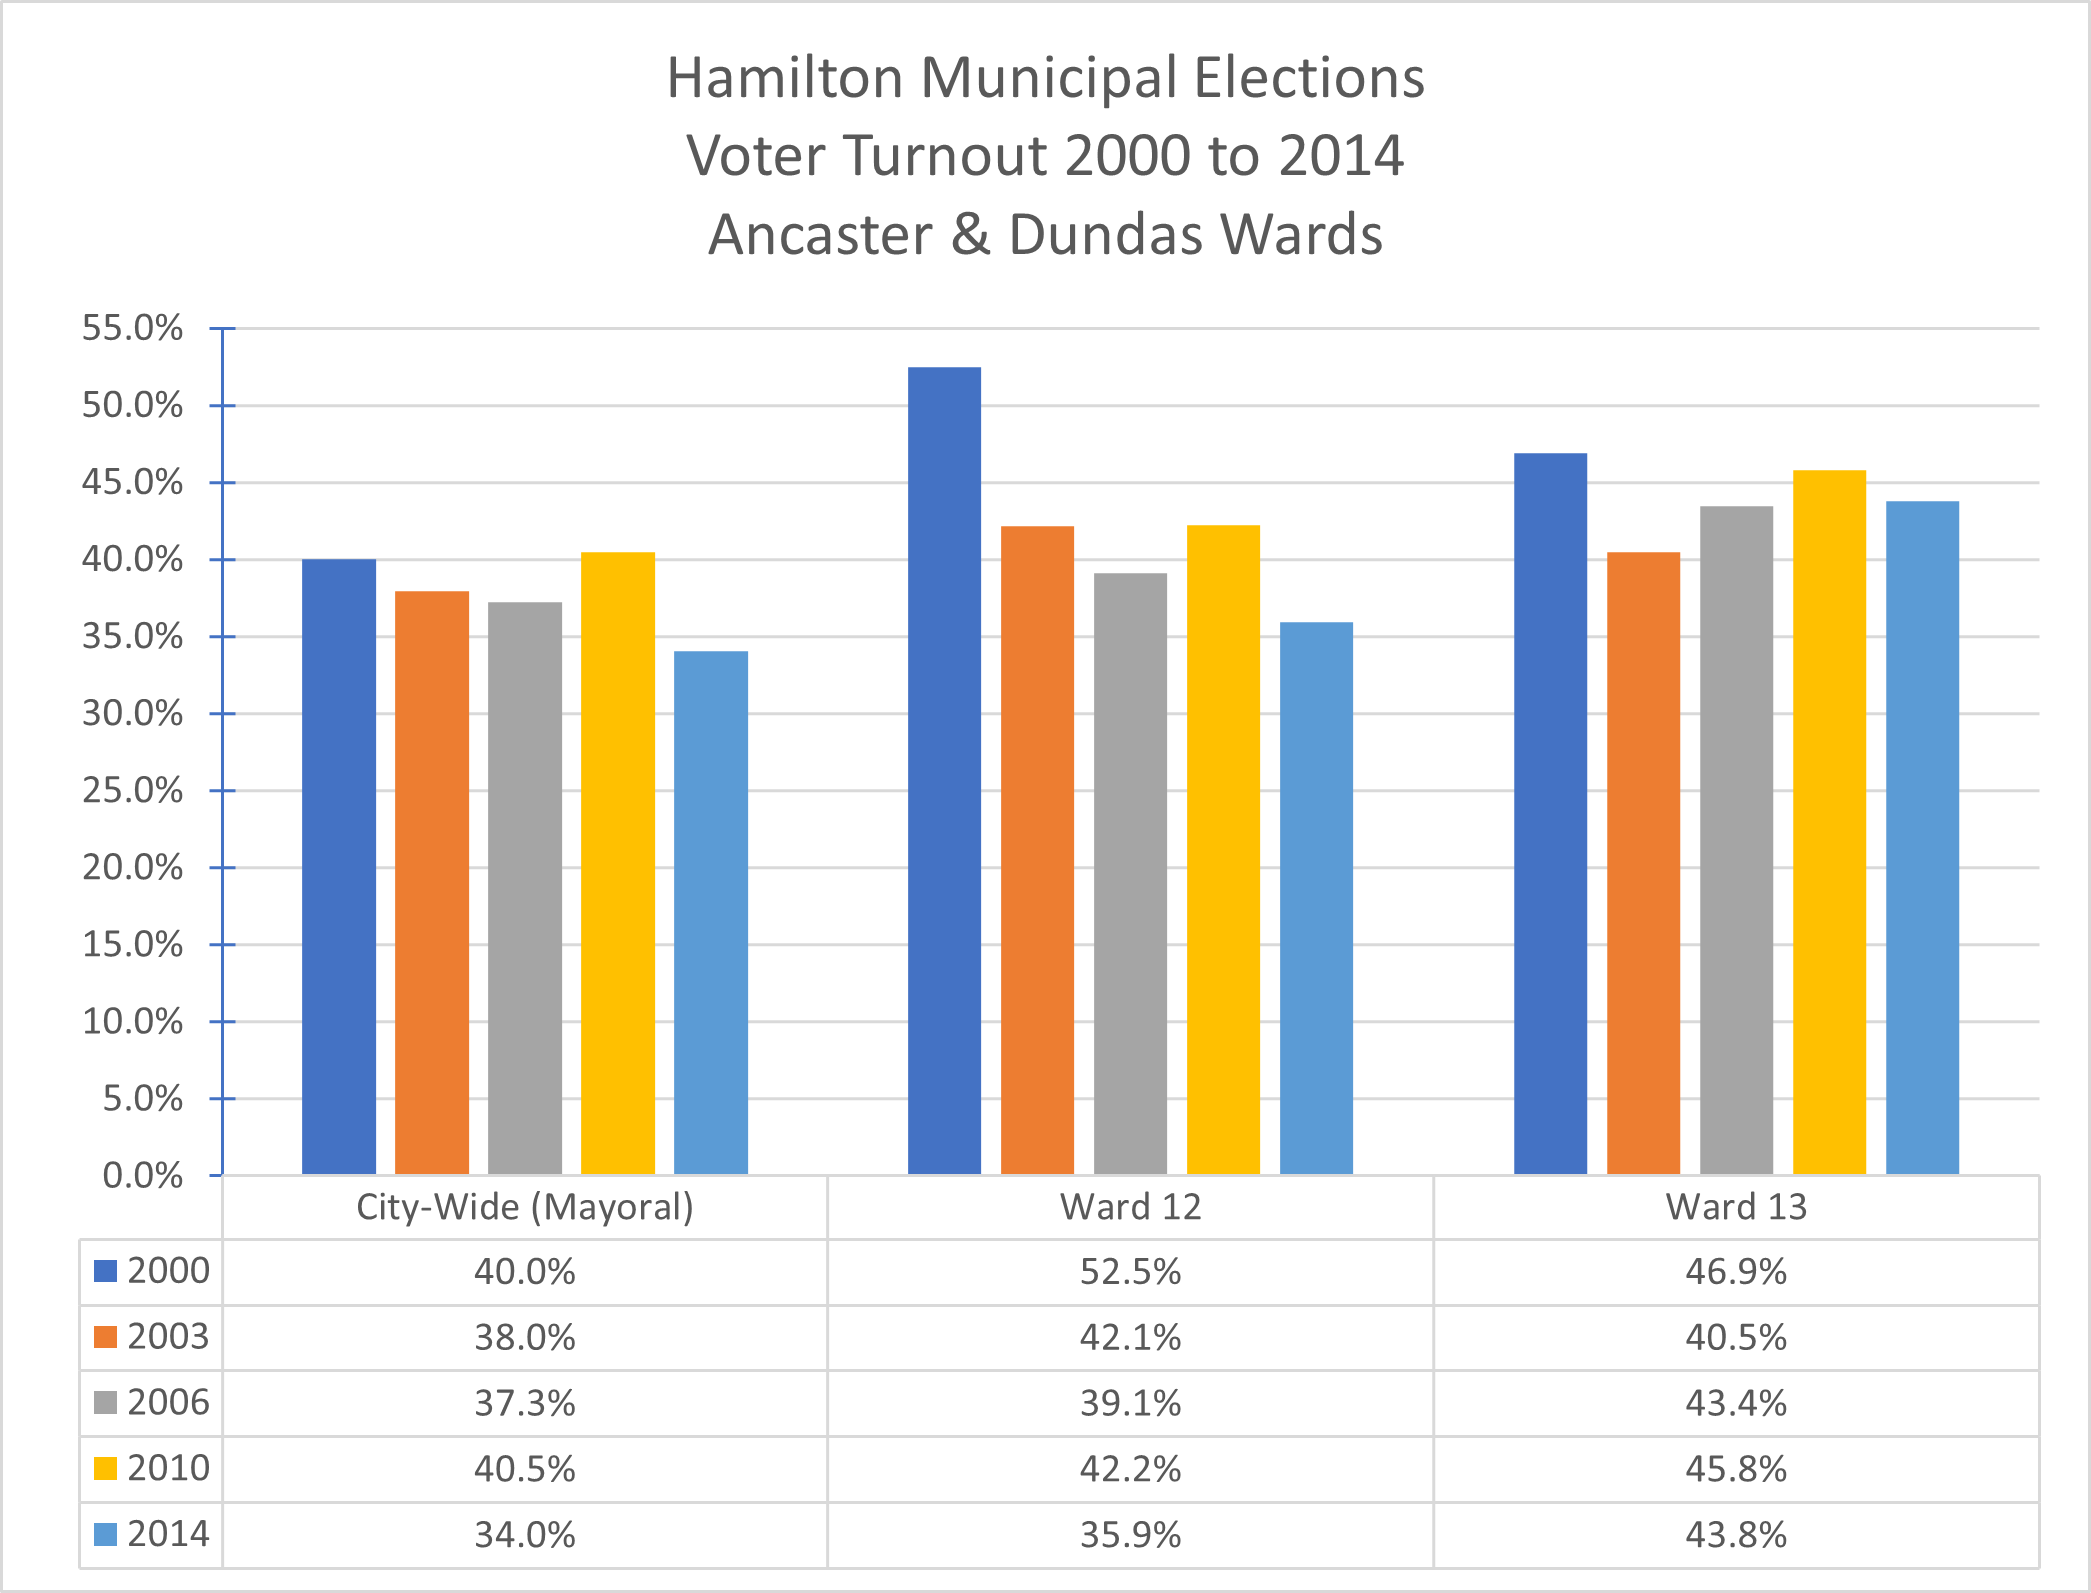
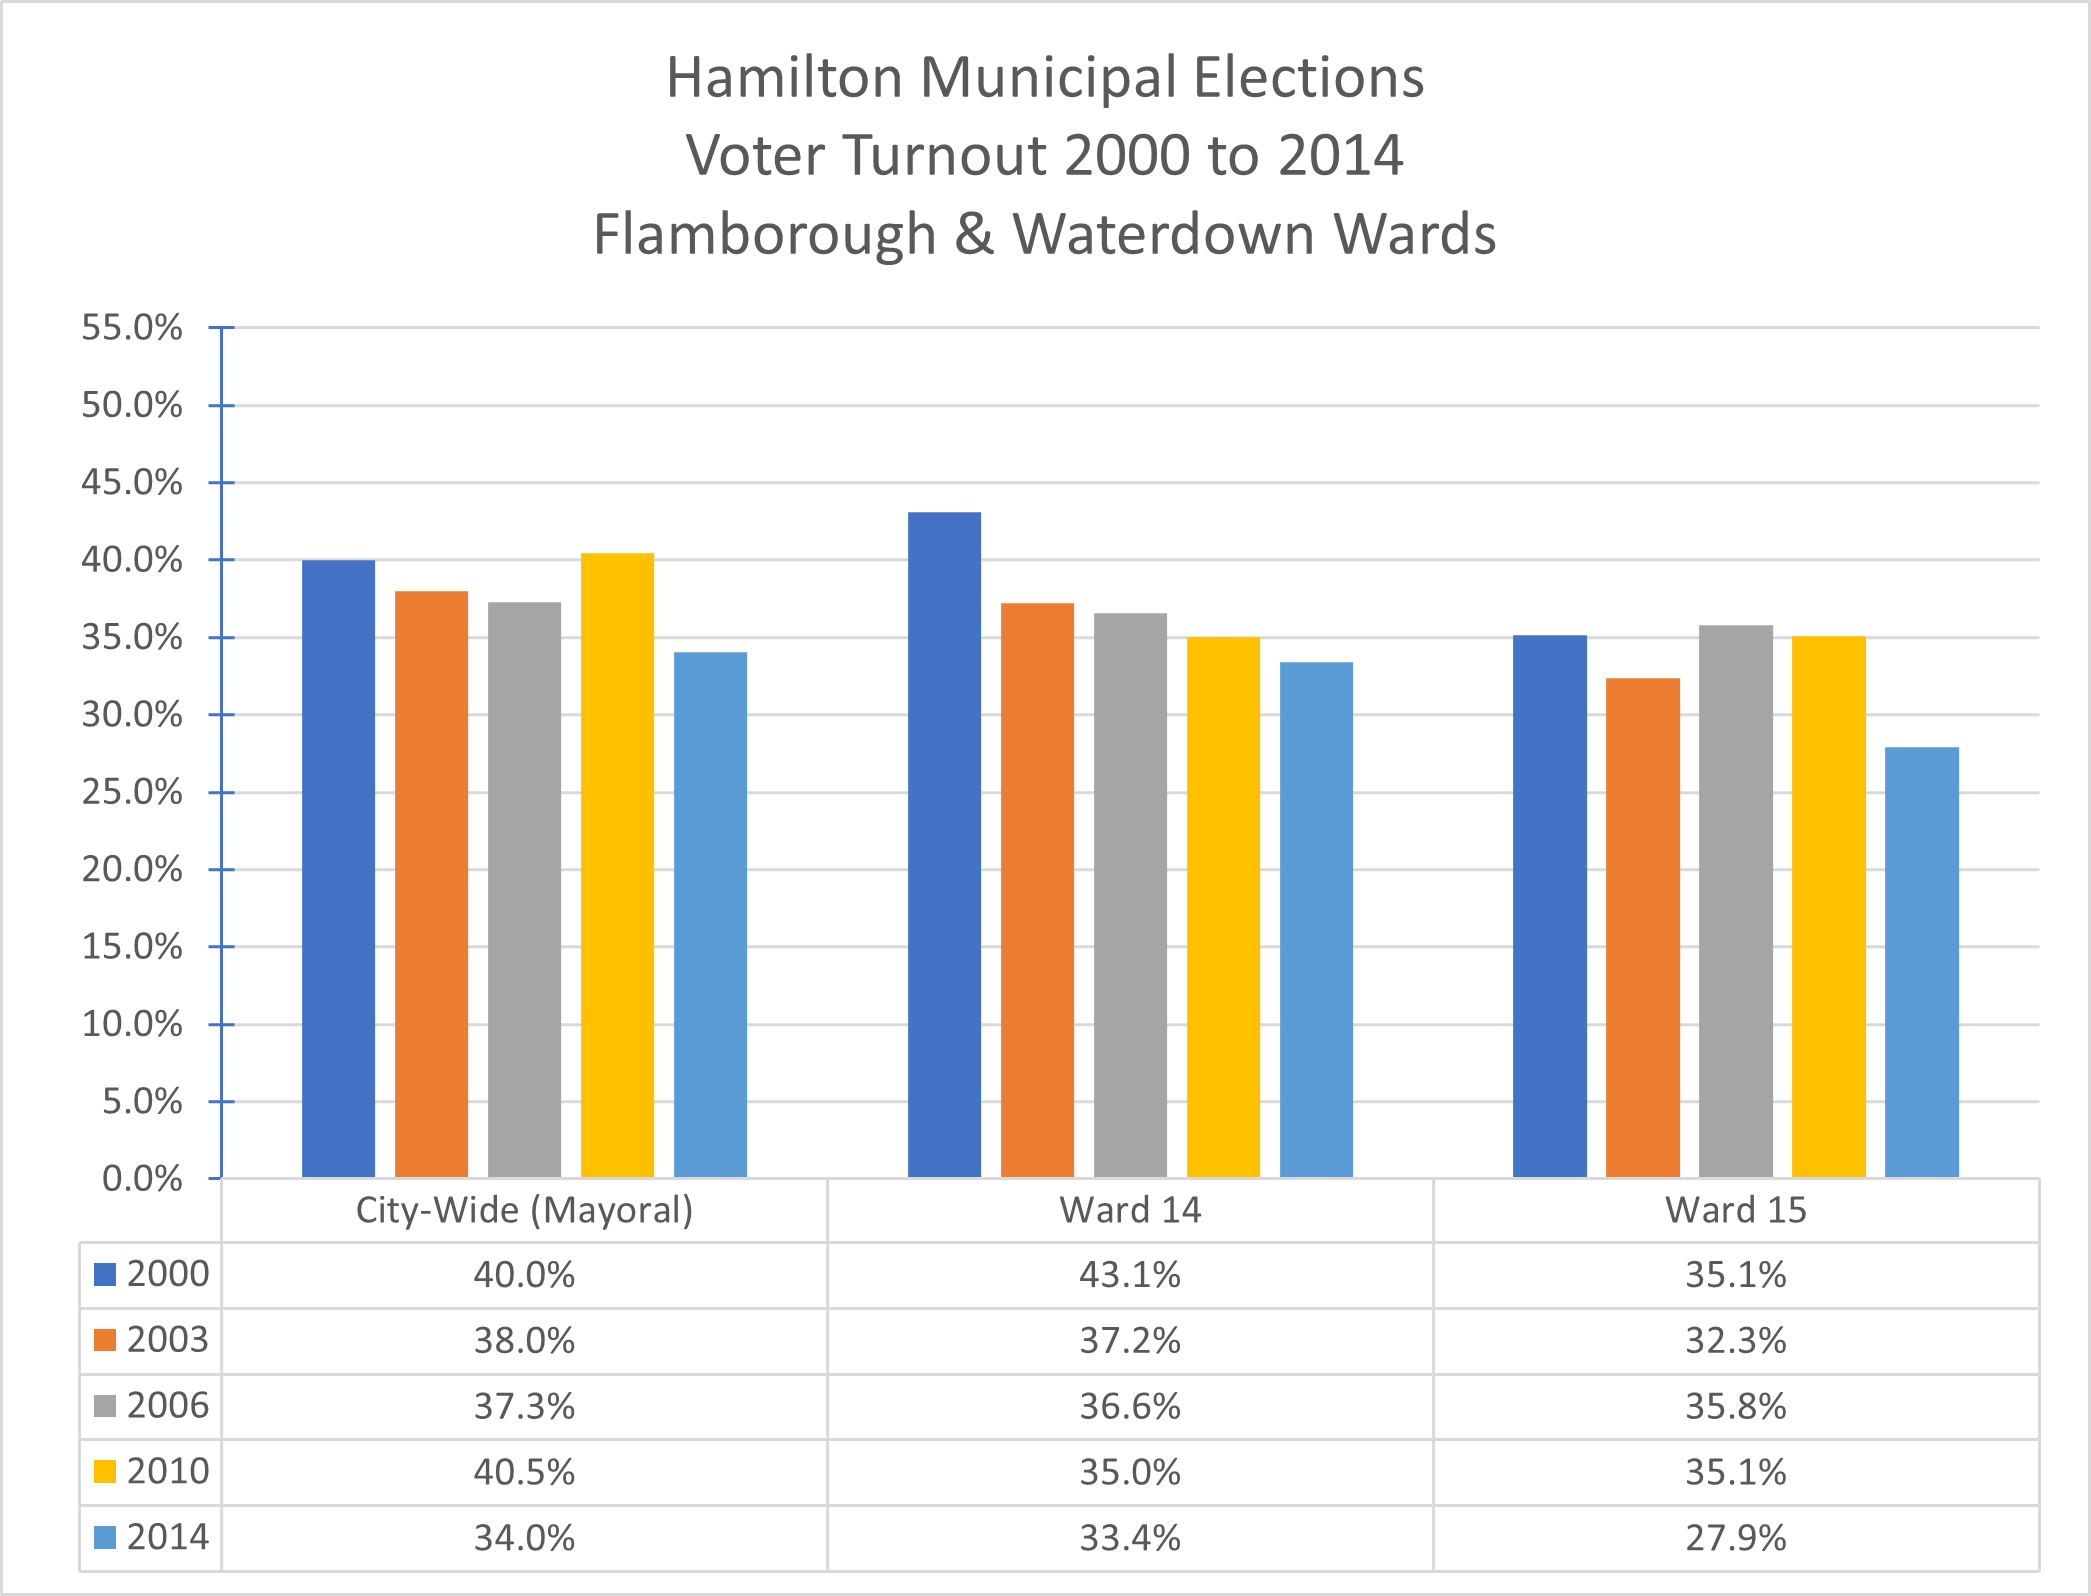
[This is the reason the ‘featured image’ for this post is a chart of 2000 to 2014 voter turnout by ward.]
The Ward numbered “14” in Flamborough was eliminated and a new Ward “14” was created on Hamilton Mountain.
The boundaries of the wards numbered 6 to 15 underwent extensive changes which make comparing voter turnout between the 2014 and 2018 elections impossible. The data is broken down to the ward level, not at the level of polling district.
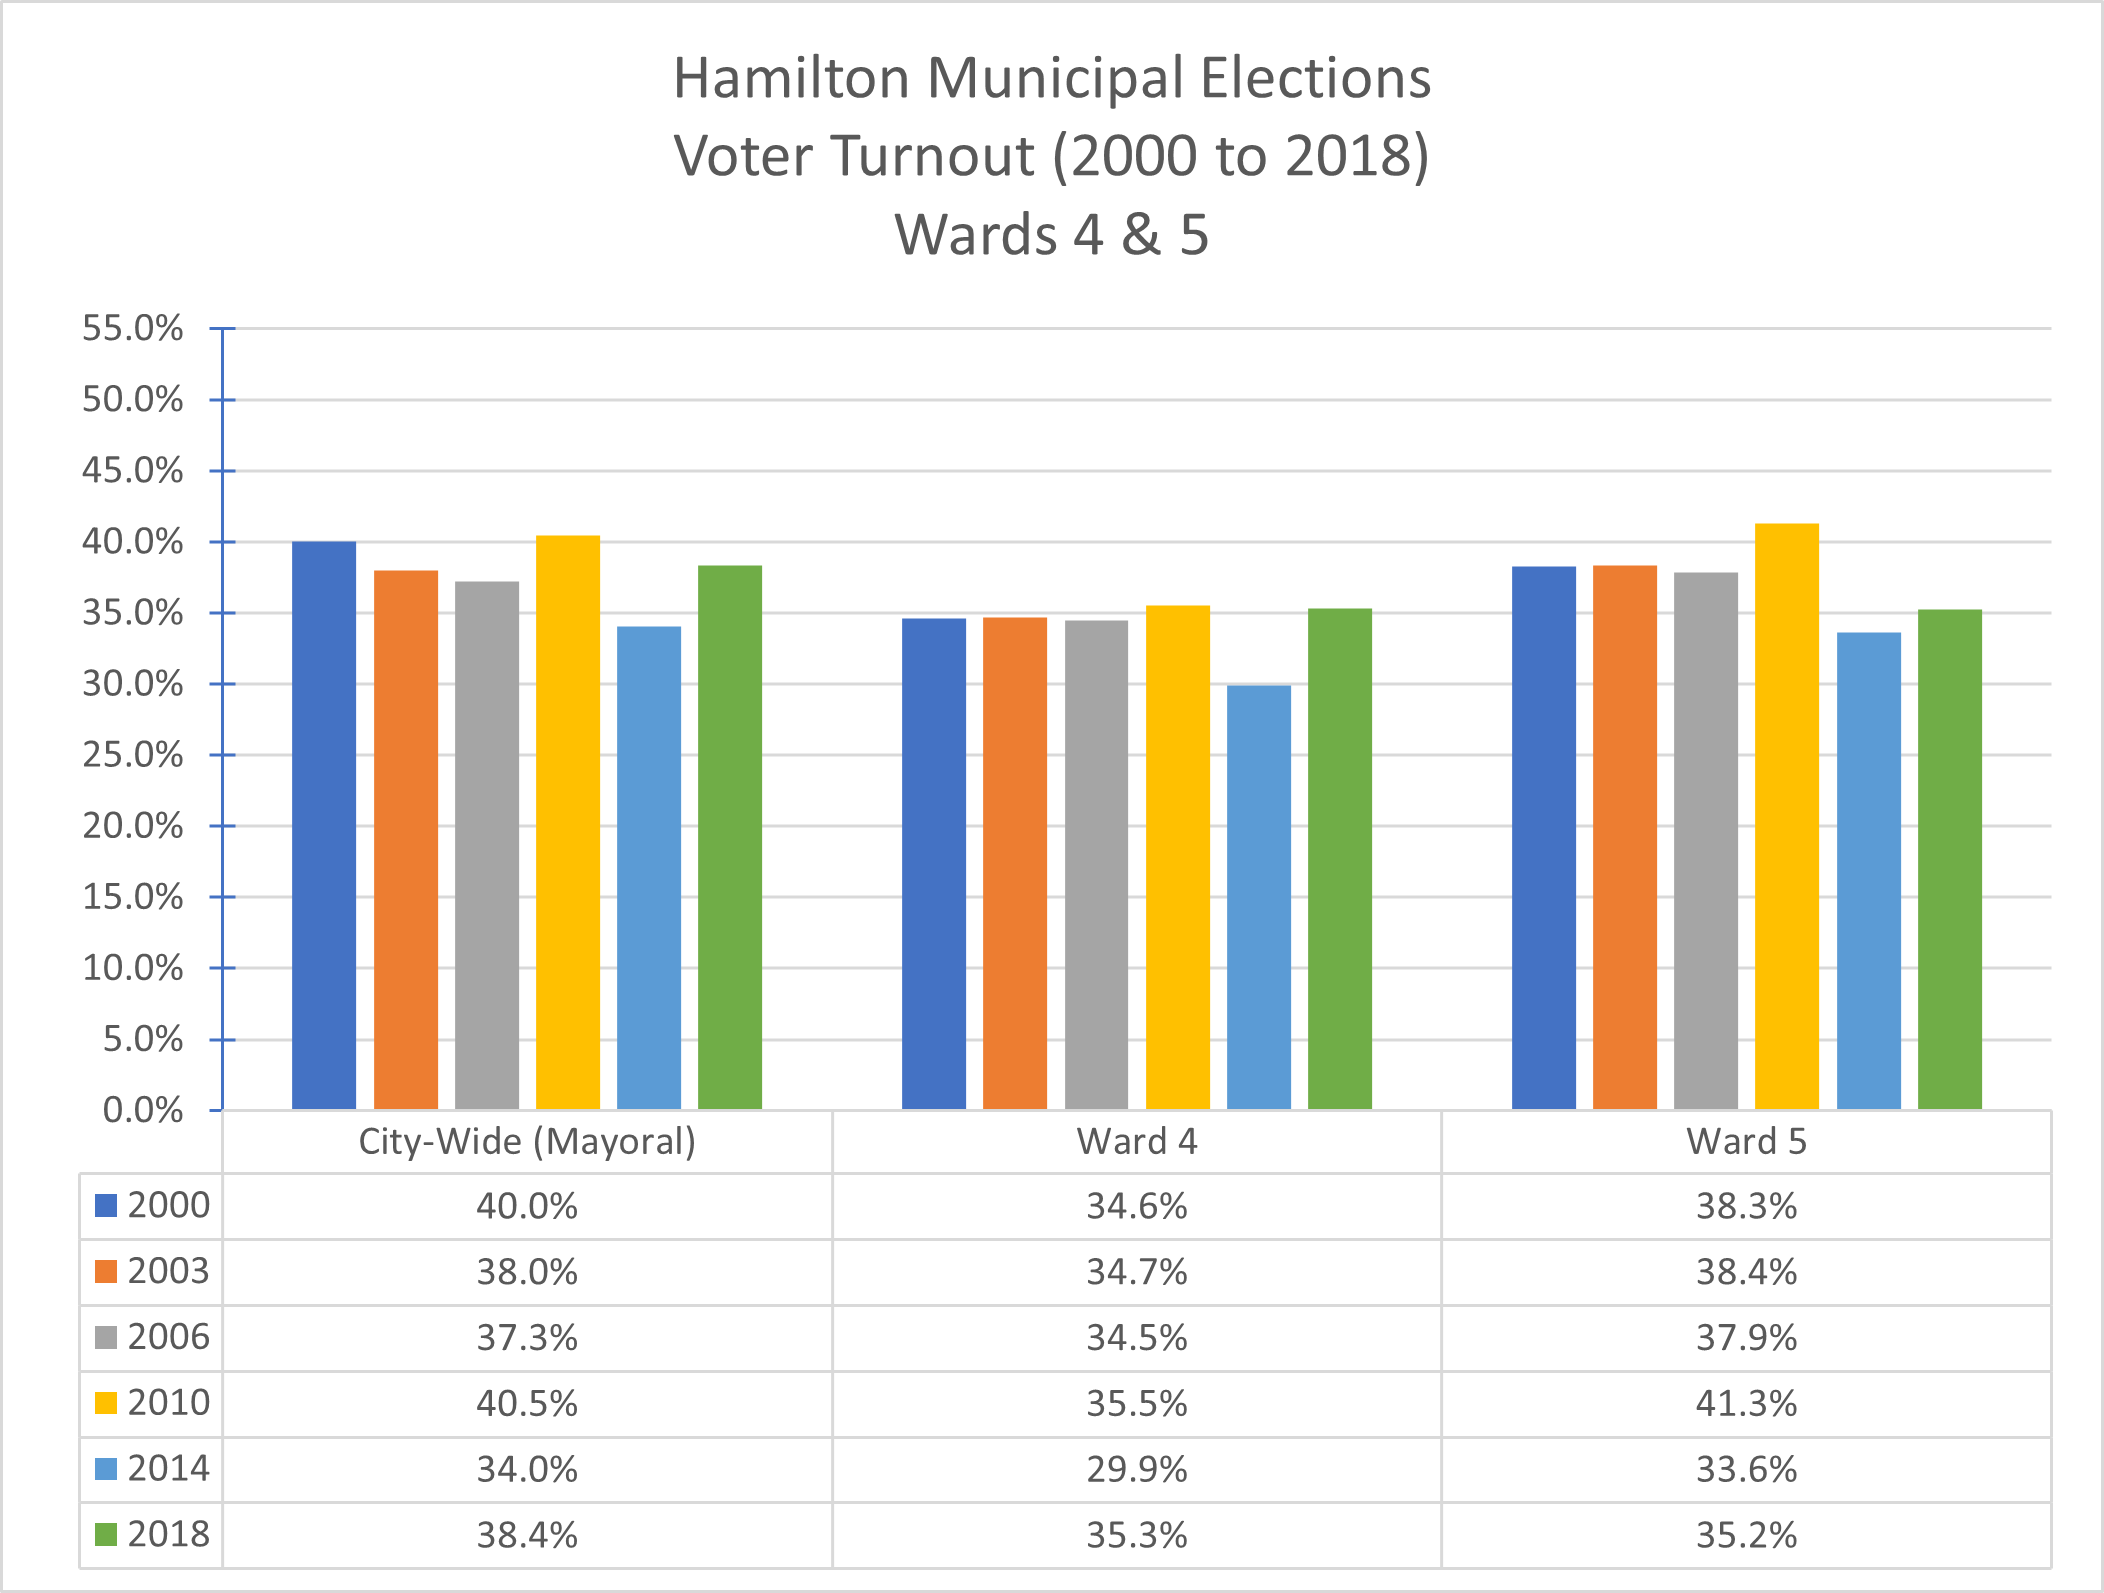
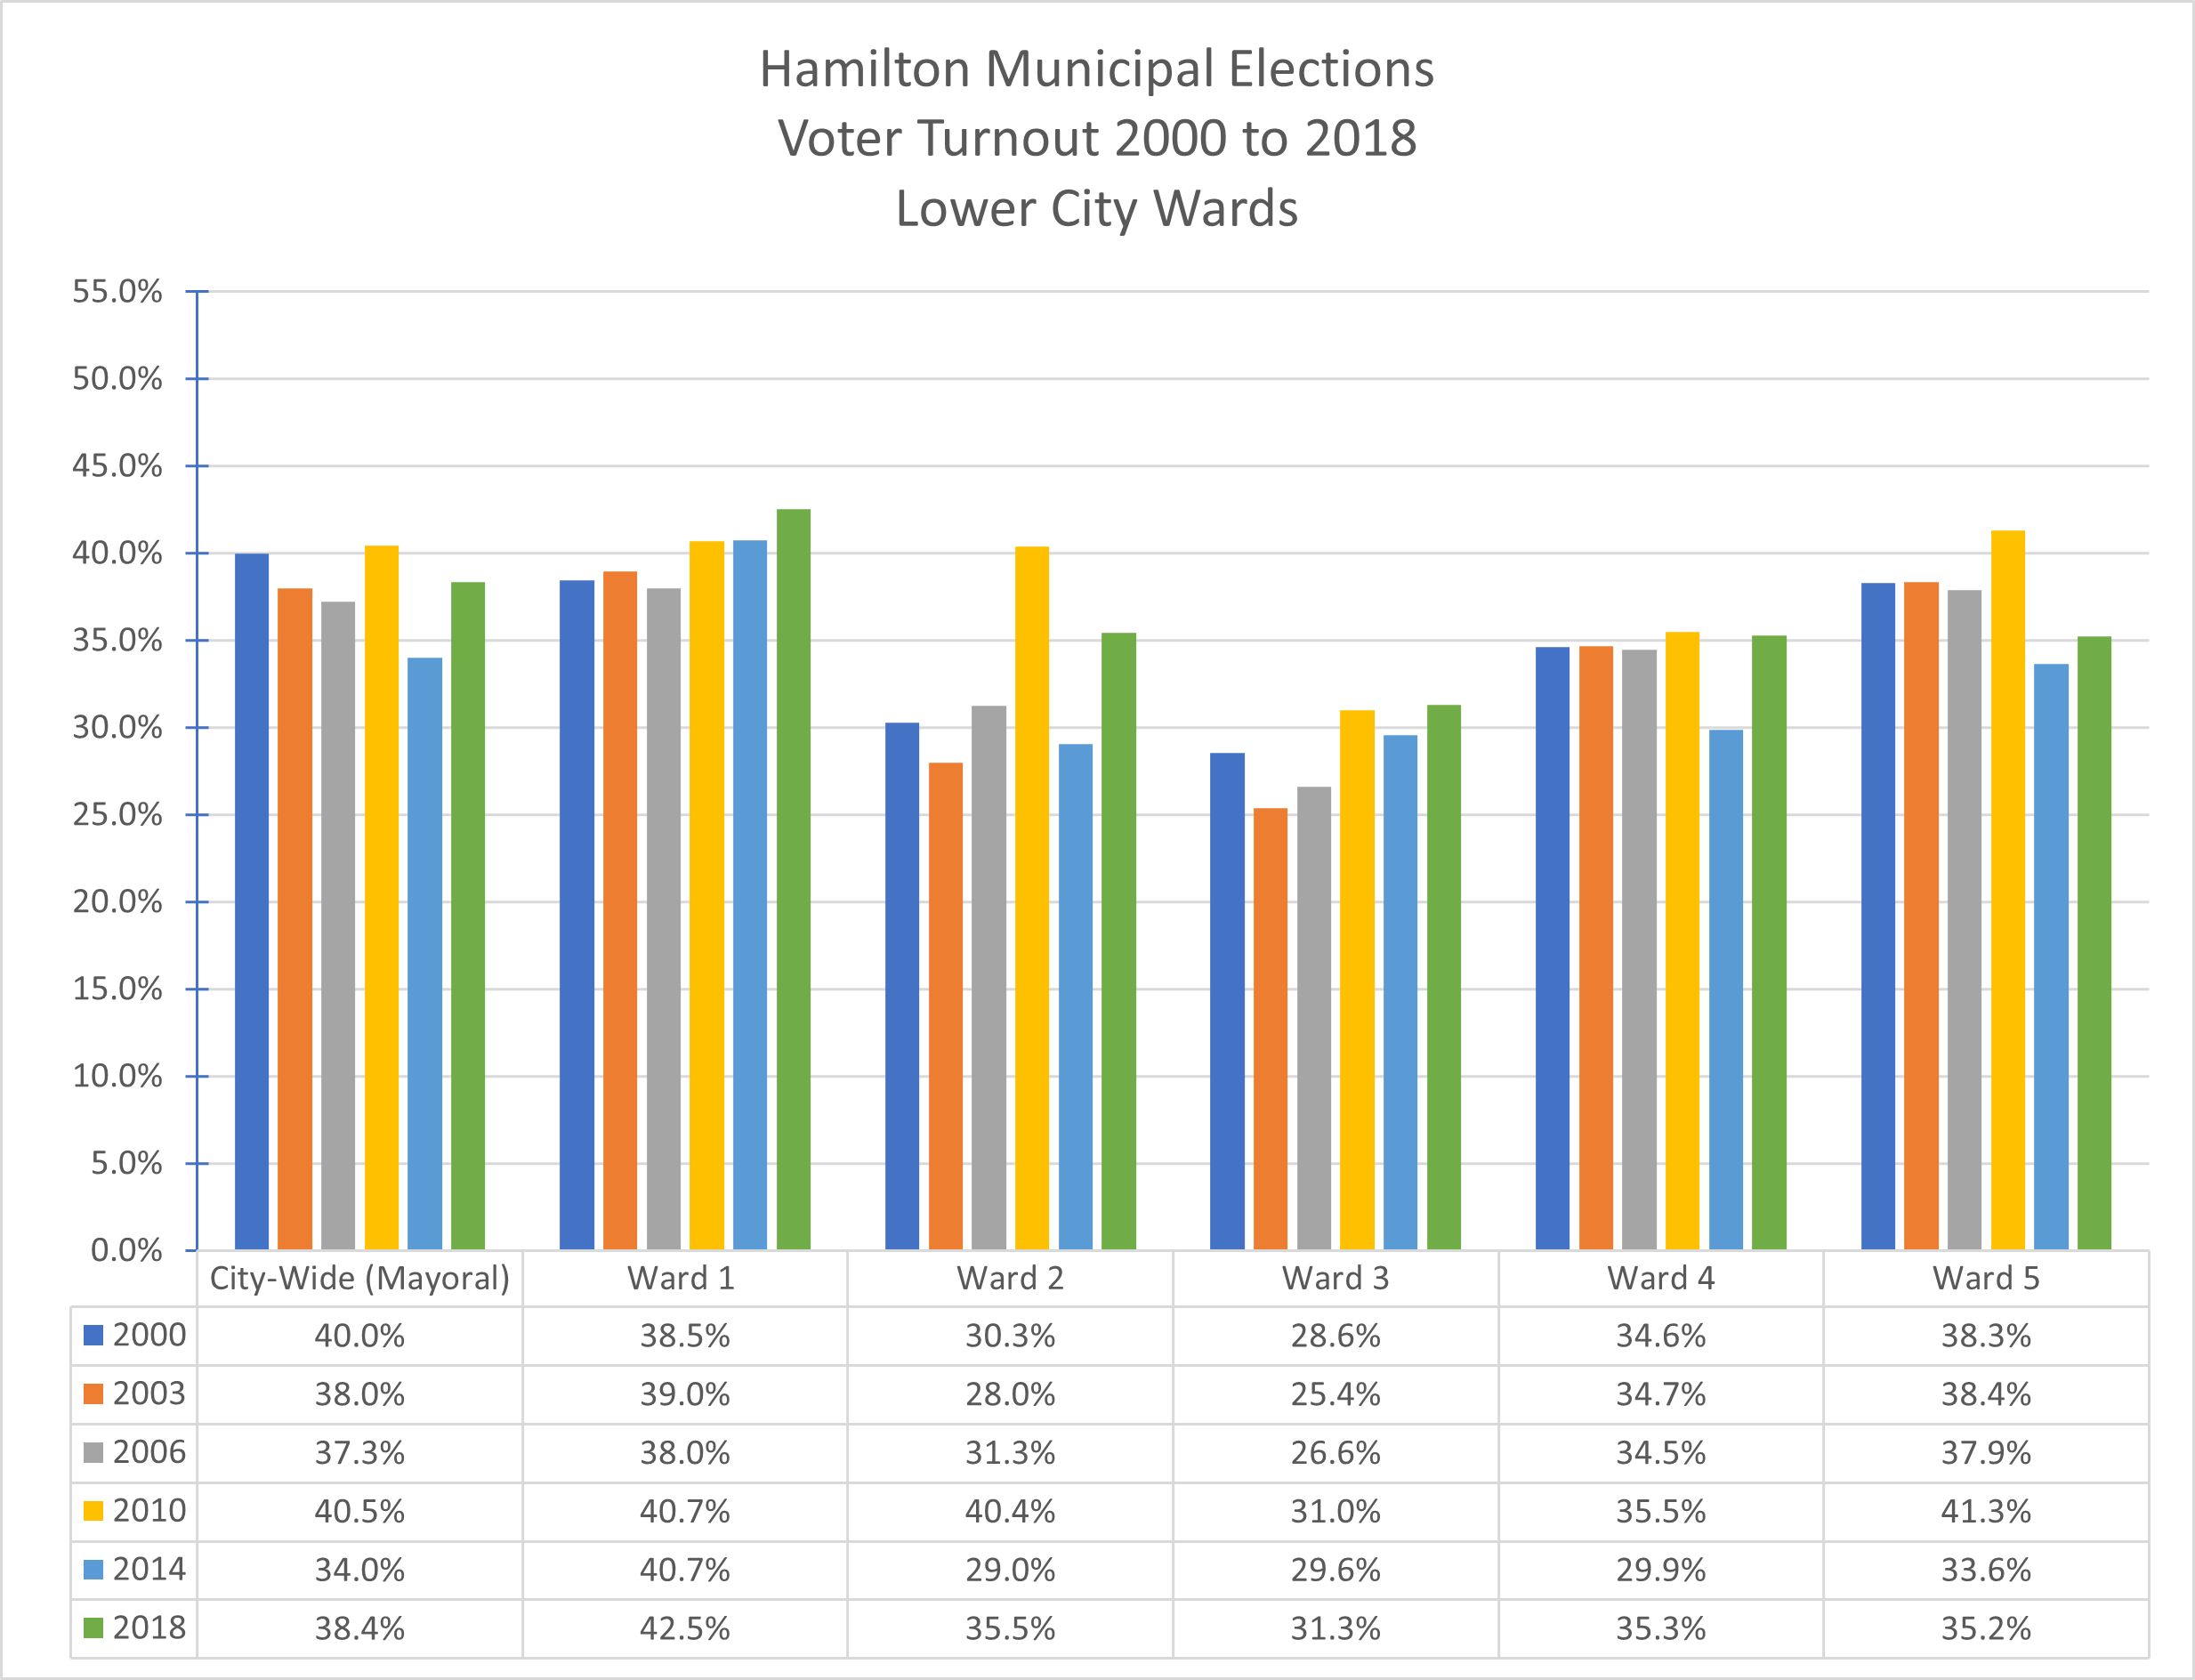
Ward 1 remained the same, Ward 2 decreased in size, with most of the Stinson neighbourhood shifting to Ward 3. Ward 4 gained the Rosedale neighbourhood from Ward 5. Ward 5 gained Olde Stoney Creek from the former Ward 9.
It is impossible to know the past voter turnout in the neighbourhoods which transferred wards. I am assuming the difference is not significant enough to invalidate comparisons of 2014 to 2018.
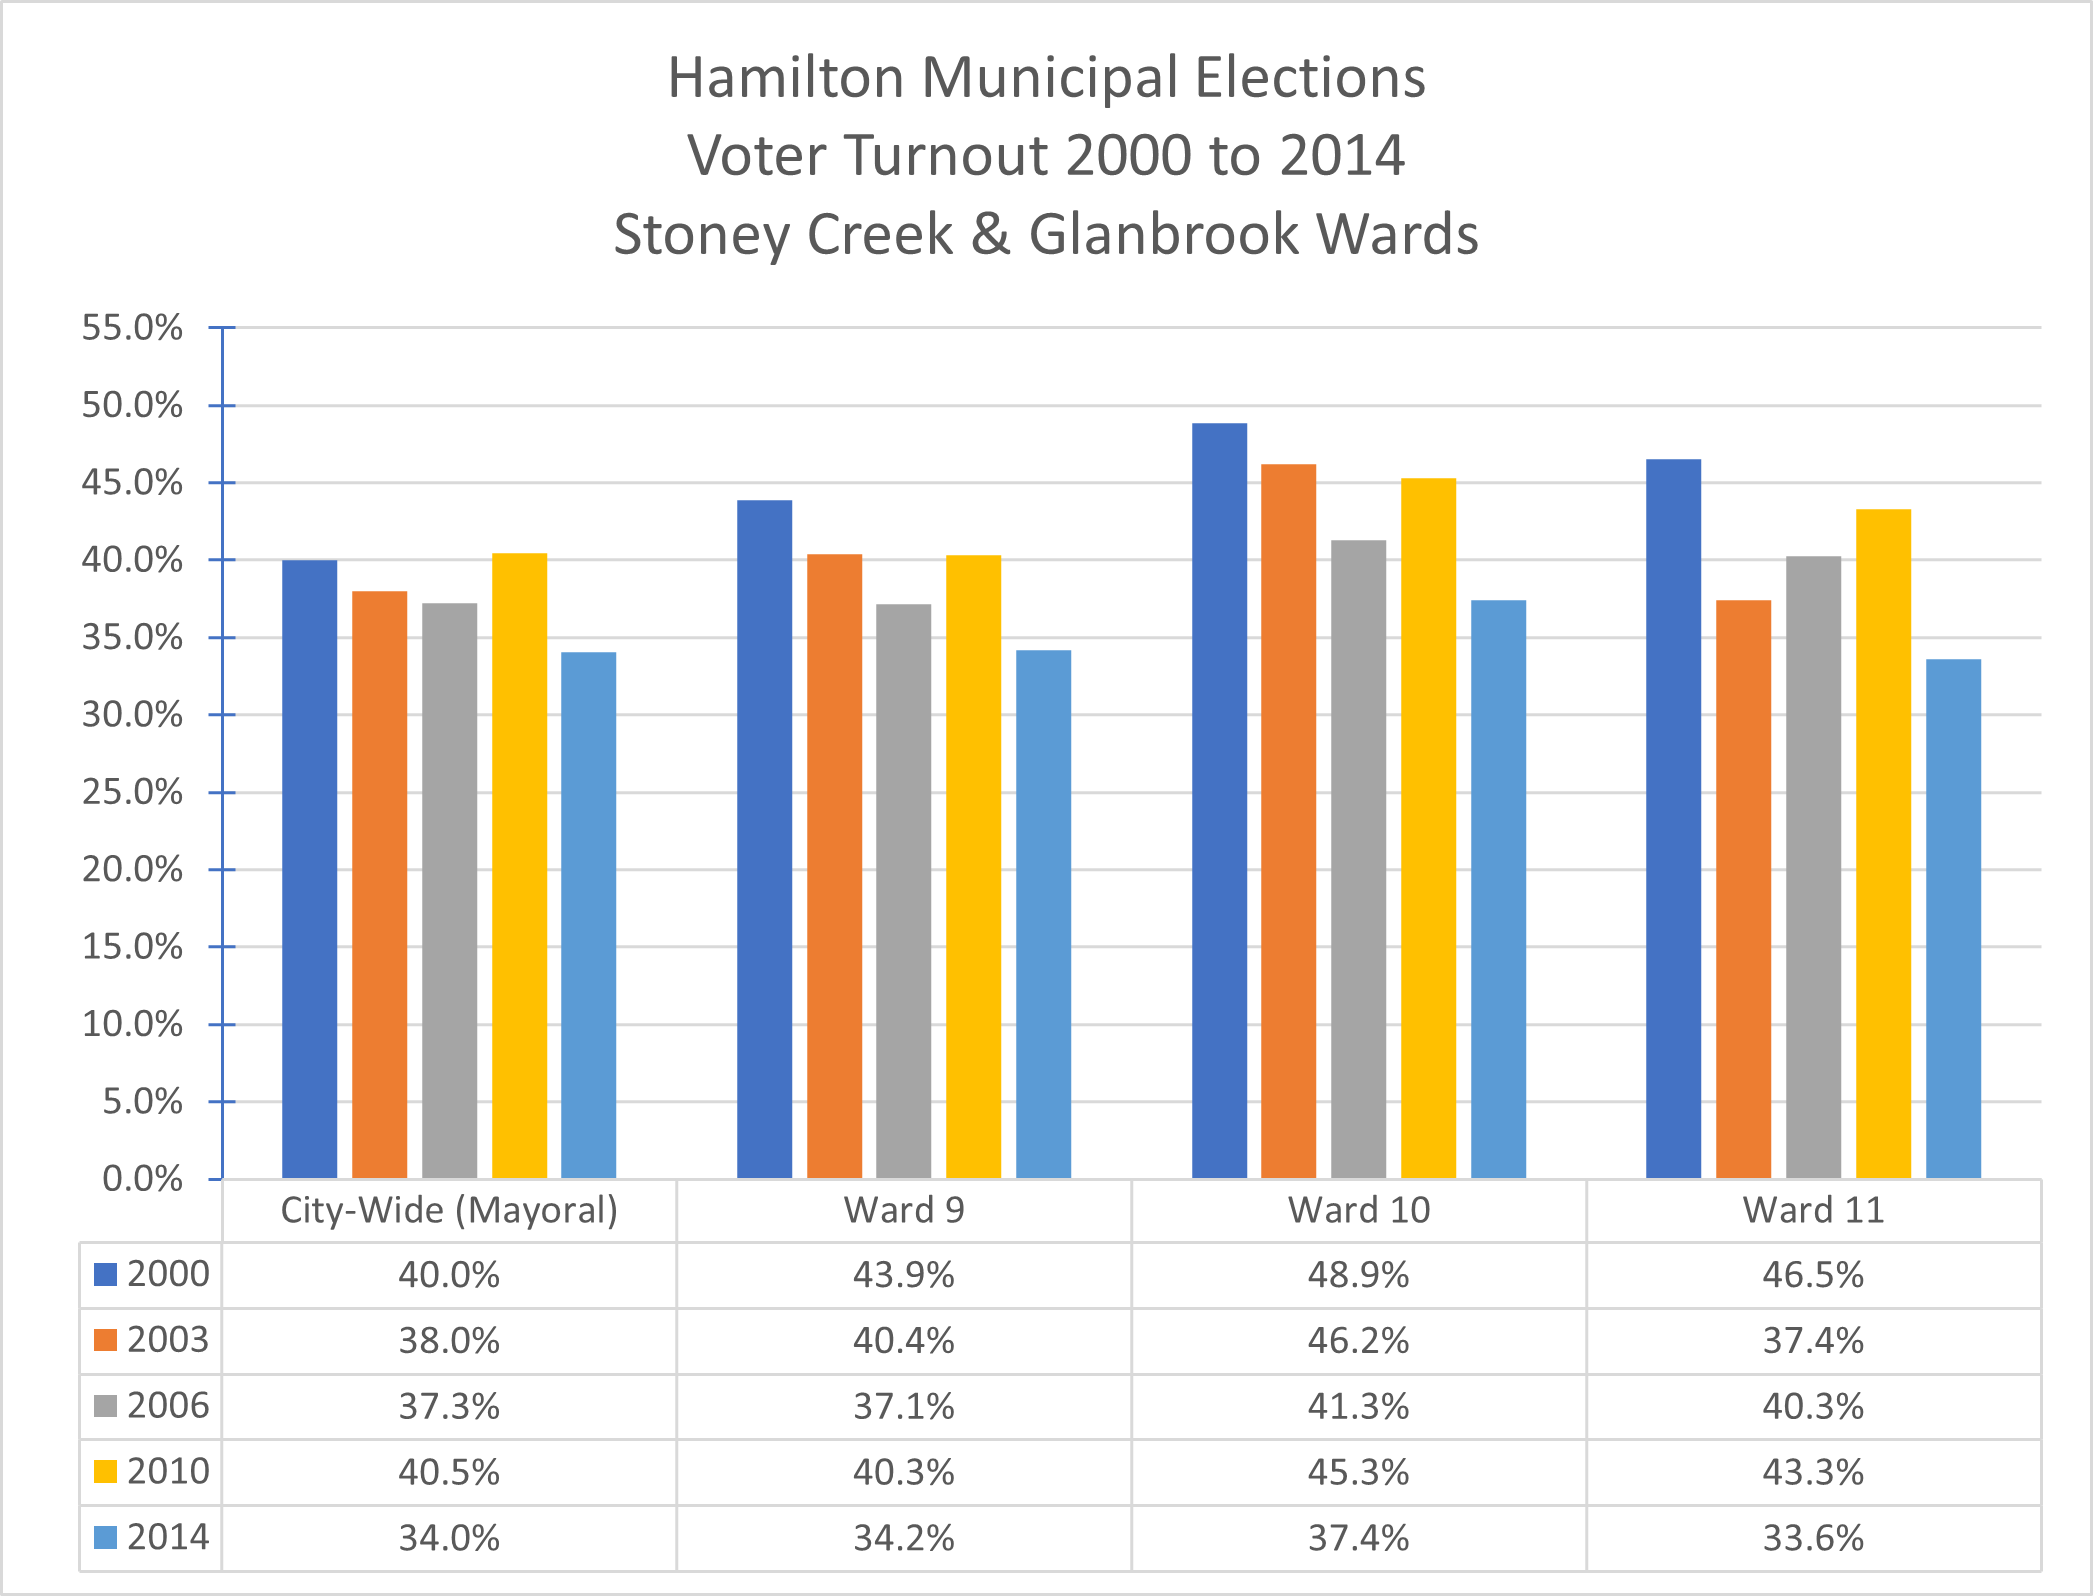
The following graphs show voter turnout by ward each election.


DATA CSV
SOURCING
2018 data: https://www.hamilton.ca/municipal-election/election-results/2018-election-results
2014 data: https://www.hamilton.ca/municipal-election/election-results/2014-election-results
2010 data: https://old.hamilton.ca/clerk/election/2010-election-results/
2006 data: https://old.hamilton.ca/clerk/election/2006-election-results/
2003 data: https://old.hamilton.ca/clerk/election/2003-election-results/
2000 data: Vallance-Jones, Fred. “Where did it all go wrong for the six-term Morrow?: [Final Edition].” The Spectator, Nov 15, 2000, pp. A01.
Ward 5 in da’ house!